
See what a Commercial Readiness Assessment produces for a diagnostics company
A complete sample report on a fictional company. Tell me who you are and I will send it over.
Most diagnostics companies can tell you what revenue did last quarter, and in a contracted model the total usually lands near plan. Far fewer can tell you which part of that revenue is at risk: the renewals coming due, the accounts buying under their committed volume, or the signed agreements that are not yet live.
That is what the Commercial Readiness Assessment measures. Five to eight of your leaders each spend 30 to 45 minutes rating 46 statements about how the commercial organization actually runs, across nine areas that go from market strategy through forecast integrity to retention and expansion. Diagnostics companies take the tailored edition, built for businesses that earn most of their revenue under multi-year contracts. Their answers produce a Commercial Readiness Index score, a clear view of where the leadership team agrees and where it does not, and a ranked list of the gaps costing you the most.
I have sat through a lot of assessments over thirty years in this sector, and most of them end in a report nobody uses. This one produces a number, which means you can run it again in a year and see whether anything actually moved.
Why do it
Most commercial organizations only get a real checkup when something hurts: a missed quarter, a lost renewal, a rep who never ramped. The CRA is a structured look taken while the dashboard still reads green, so small problems get fixed before they turn into forecast misses or board surprises. When most of the revenue is already under contract, that lead time matters more, not less, because a weak selling and renewal motion can go unnoticed for years and then show up in a single re-bid cycle.
- Independent second set of eyes. An outside, operator grade read on the questions a board or a buyer will ask.
- Validates where to invest next. Shows which commercial investments are paying back and which are not.
- Ranked roadmap. Sorts the work by how much each item would move the score, so the team spends its time on the few things that matter.
- A read across the whole leadership team. It pulls input from sales, marketing, commercial operations, support, implementation, and finance, and shows where they agree and where they do not.
What is in the sample report
The full report for Ravenna Diagnostics, a fictional in vitro diagnostics company built for this purpose. It runs to 17 pages and covers the seven leaders who took part, the score and its band, the nine areas scored and ranked, where the team agrees and where it splits, a 90-day plan with named owners, and the CommEx tools and KPIs behind that plan.
- Where a leadership team disagrees, and why. Seven leaders rated the same 46 statements. Scored through the VP of Sales's answers, the company comes out at 56.7. Scored through Customer Implementation, it comes out at 25.1. The report shows where that gap sits and how the team closes it.
- How the priorities get ranked. The nine areas are ranked by how much each would move the score, not by which scores lowest. That ranking becomes a 90-day plan with owners, dates, and the tools and KPIs behind it.
- Exactly what a client receives. The structure, scoring and output are the same as a live assessment, on a fictional company. You can judge the method before spending any time on it.
Ravenna sells automated testing systems to hospital laboratories, health systems and reference laboratories, with most of its revenue coming from reagents, consumables and service under five to seven year agreements. The same assessment runs in diagnostics companies of any size, with the weighting set to the business.
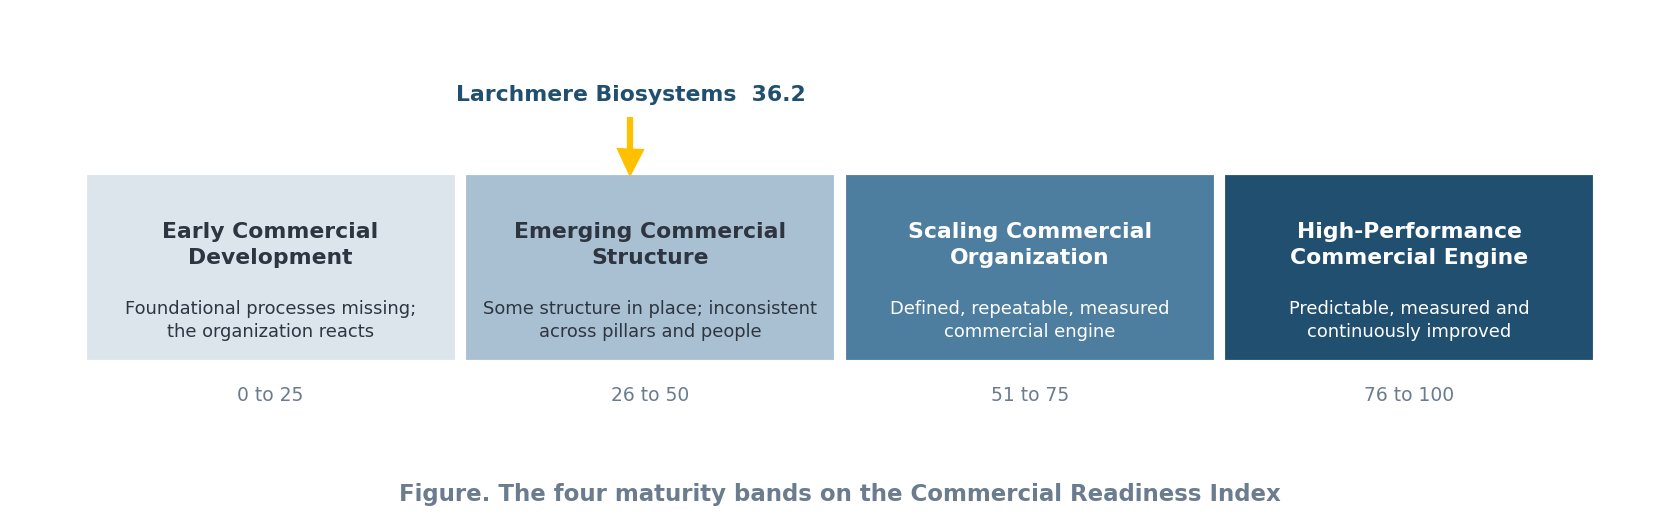
Ravenna scores 38.1 out of 100, which puts it in the Emerging band. The more useful finding is the split underneath it: the VP of Sales counts what is signed, while the CFO and CEO count what happens after signature, and the company does not yet measure the second.
Client assessments are confidential, so Ravenna is a composite, put together from patterns that come up again and again in diagnostics companies. The numbers are illustrative. The structure and the output are exactly what a client receives.
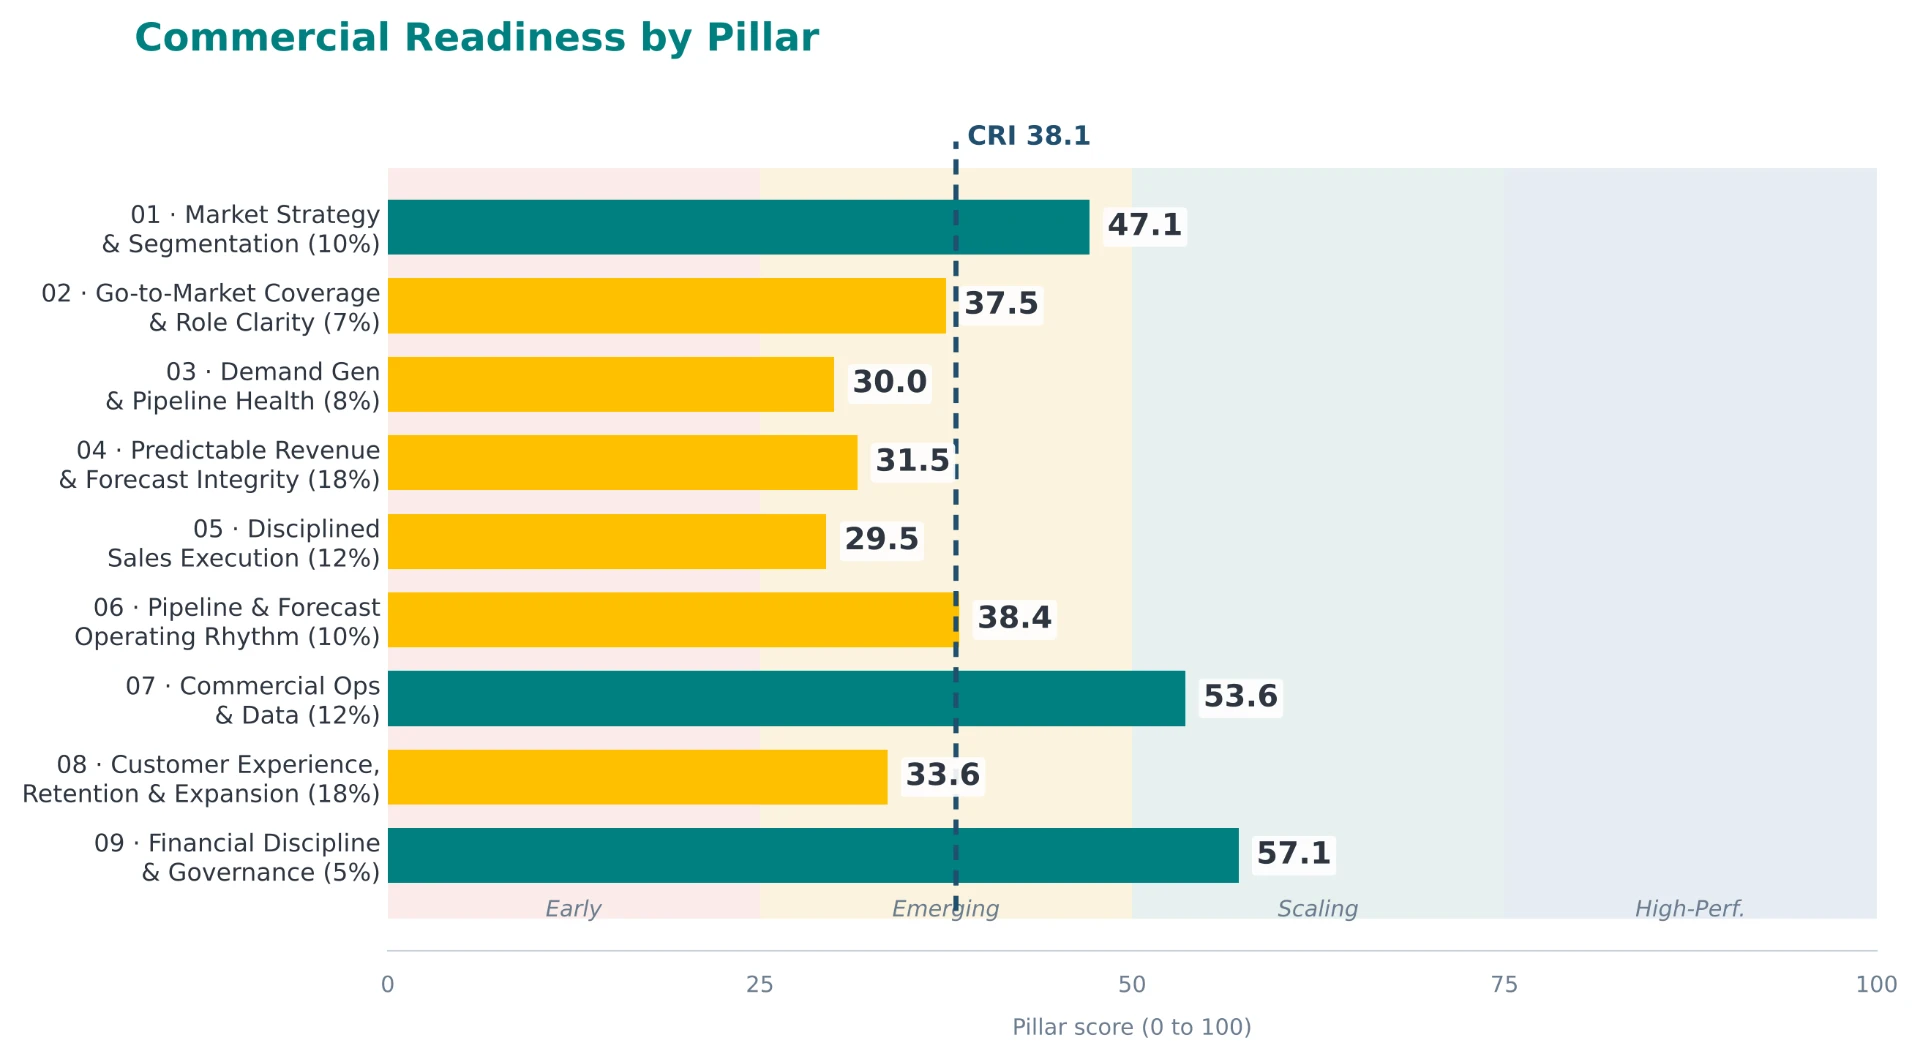
Ravenna's weighted score is 38.1, in the Emerging band. Financial discipline (57.1) and commercial operations and data (53.6) are the only pillars above 50. The pillars that win, forecast and defend revenue sit far lower: sales execution at 29.5, demand generation at 30.0, forecast integrity at 31.5 and retention and expansion at 33.6. The company can report the revenue it already has, but it has much less visibility into the revenue it is about to keep or lose.
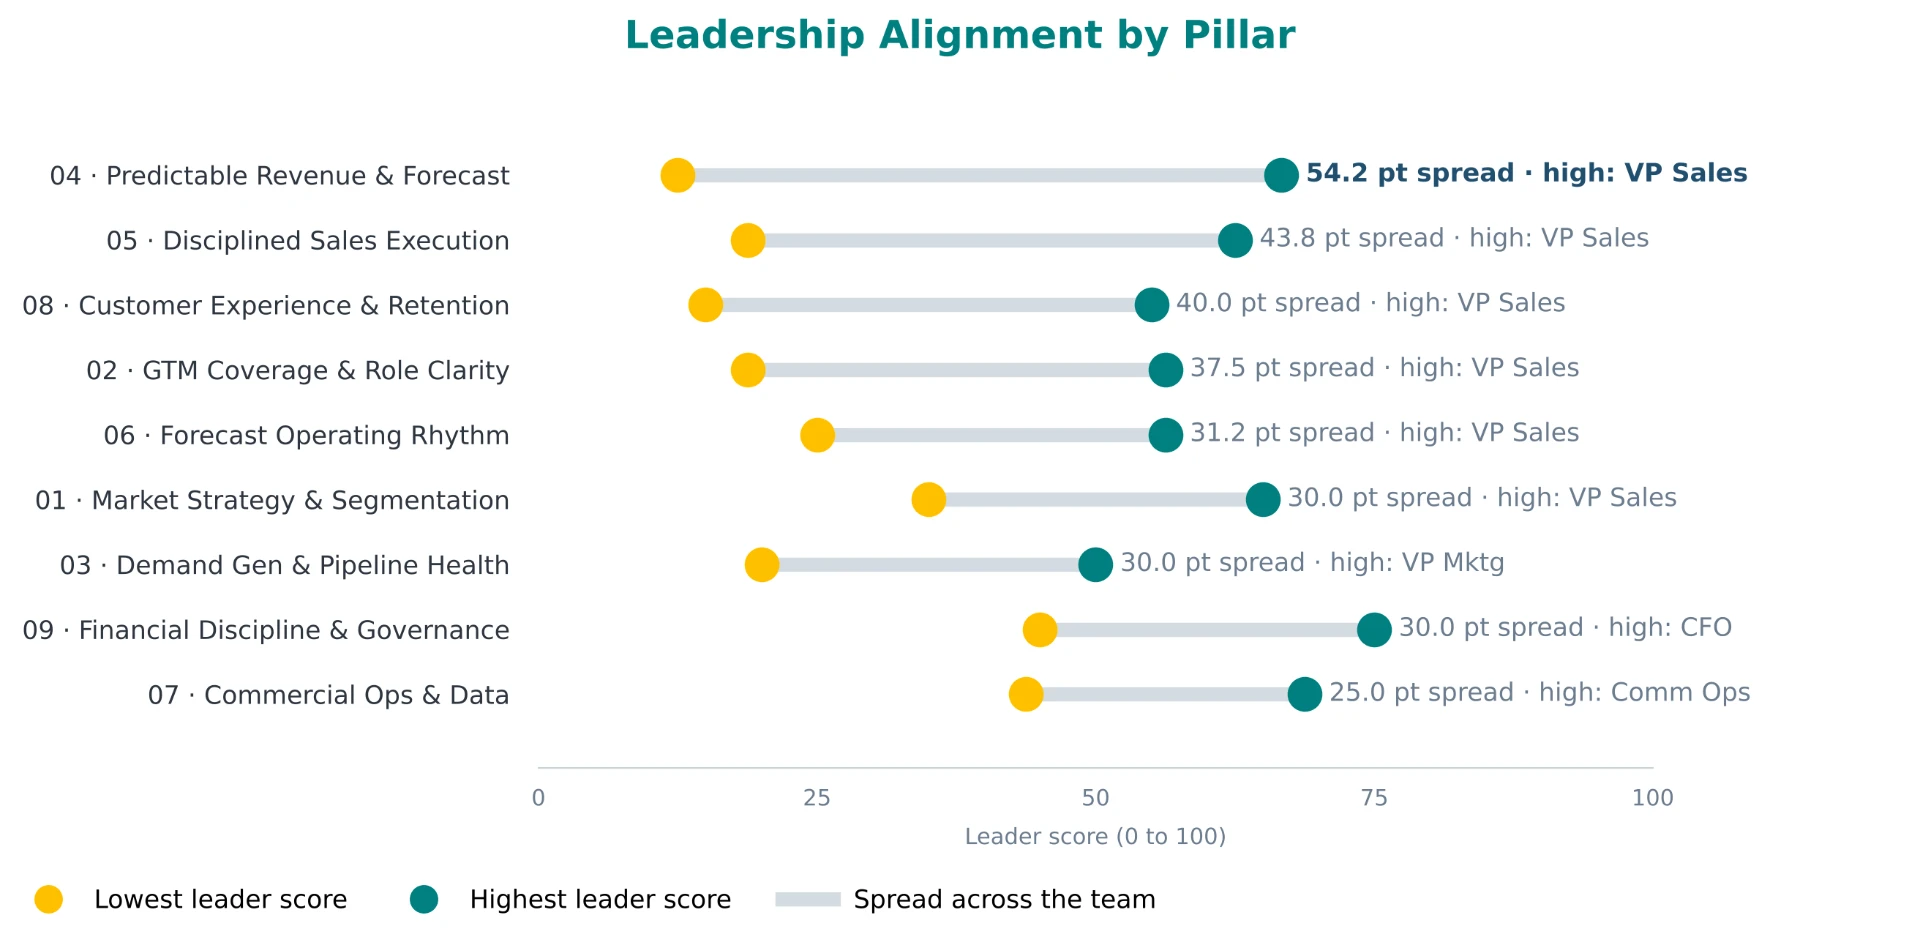
The widest split is on forecasting: the VP of Sales scores forecast integrity at 66.7 and the CFO at 12.5, a 54.2 point spread on one of the two heaviest pillars. The VP of Sales holds the high score on six of the nine pillars. The team agrees most on the documented work, commercial operations and financial discipline.
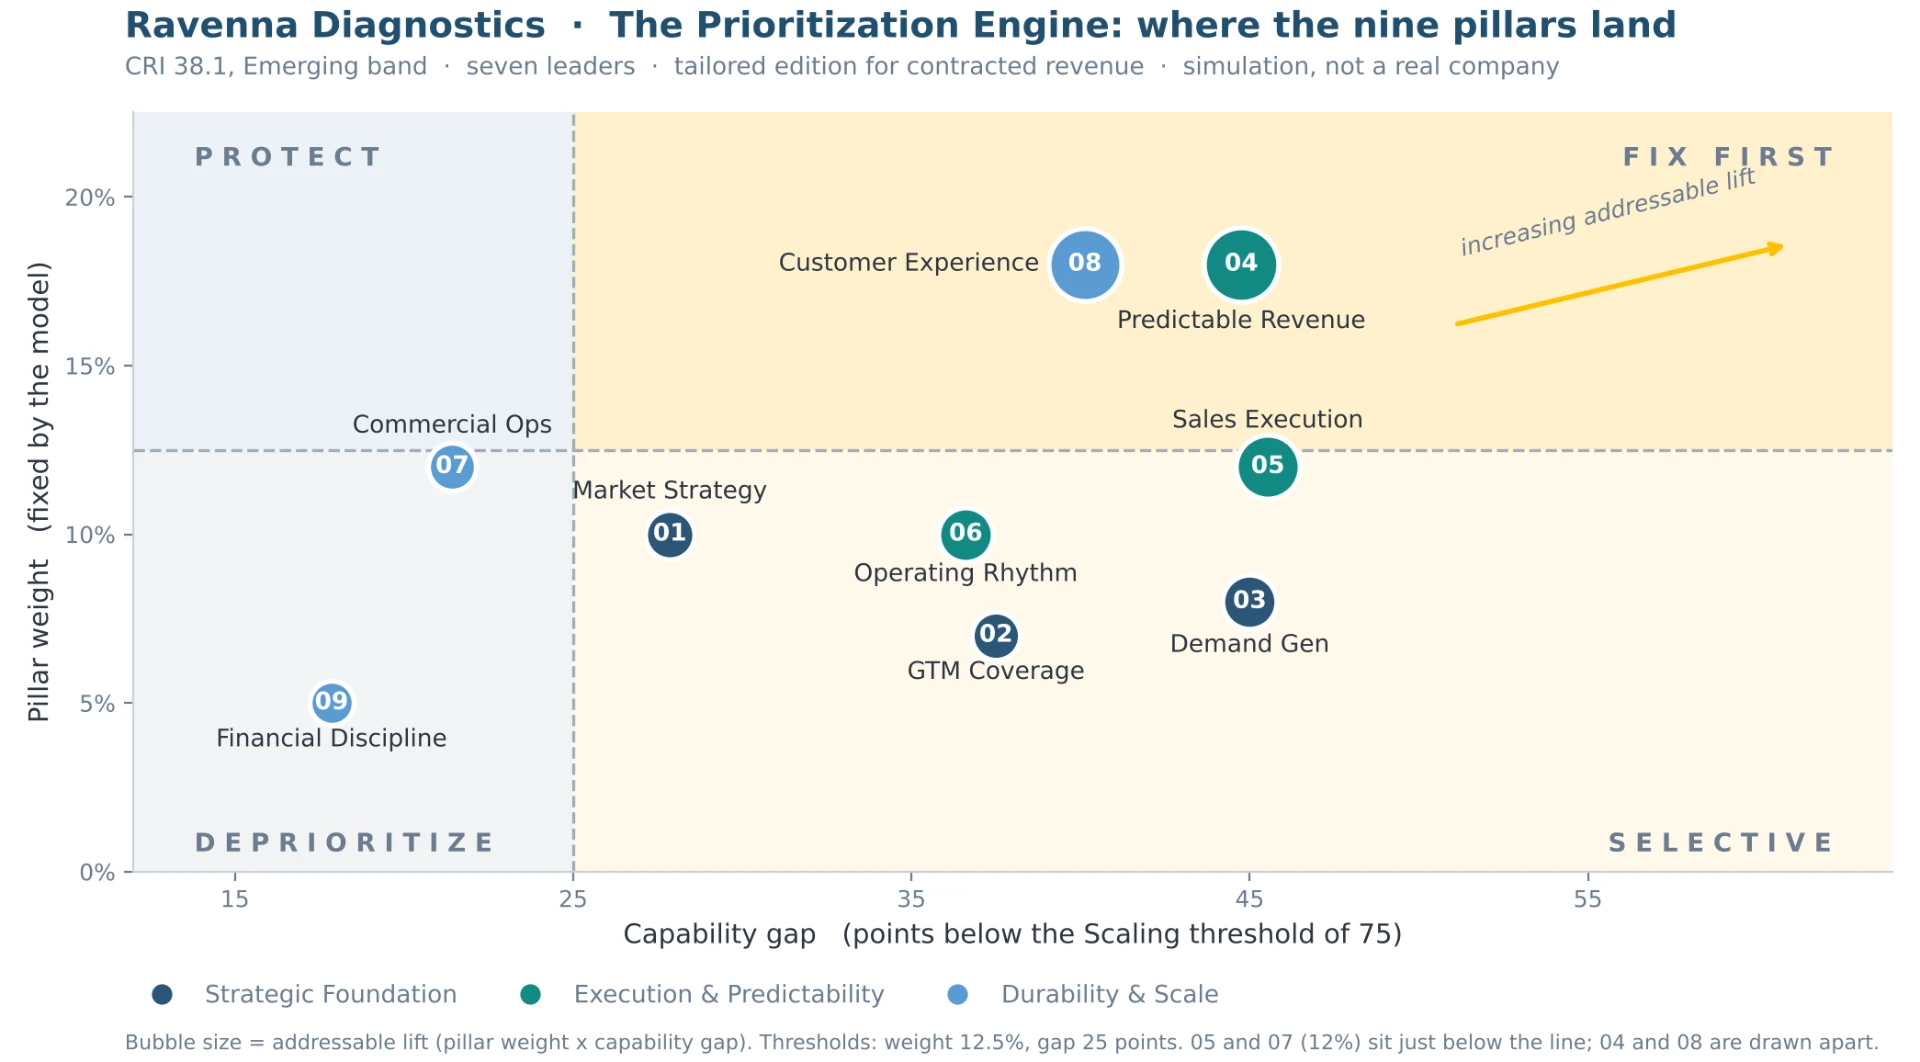
The report ranks pillars by how much each would move the score, not by which scores lowest. Forecast integrity offers the largest lift at 7.8 points, and retention and expansion follows at 7.5, because both carry the heaviest weight at 18 percent. With the pipeline and forecast operating rhythm, these three account for 18.9 of the 36.9 points available, and they become the first 90 days of the plan.
Send me the sample report
I send each report personally, usually the same day.