
What a buyer does with your forecast, and why it is visible long before anyone opens a data room.
By J Chad Brown, CEO, CommEx Advisors. Former SVP of Sales and Marketing, NanoString Technologies (2017 to 2022).
Published October 31, 2026
Why would a buyer or an analyst trust your forecast when it has missed quarter after quarter? The discount they apply is one of the largest a commercial organization can put on its own company. It is also one of the most avoidable, because it is based on data rather than impressions, and proven steps can improve accuracy and repeatability. Whether positive or negative, you're creating that data in the quarters you are in today.
How much is forecast accuracy worth?
Public companies show it most clearly, because the market prices a missed forecast the same day.
In July 2019, Illumina said population genomics deals it expected to close in late June had not closed, and cut its revenue growth forecast for the year from 13% to 14% down to about 6%. Its shares fell more than 16% in after-hours trading.
In October 2024, 10x Genomics reported preliminary third-quarter revenue of about $151.7 million, below what analysts expected, and said changes to its commercial organization had been more disruptive than expected. Its shares fell about 25% the next day.
Neither miss was about the science or the market. In one case deals slipped out of the quarter, and in the other a commercial reorganization went worse than planned. A commercial reorganization isn't just a change in structure. The bigger effect comes from the lack of process during the transition.
A private company doesn’t have a share price, but a buyer applies the same logic in its model. It reduces a forecast it doesn’t trust, and that reduction comes straight off the value of the company.
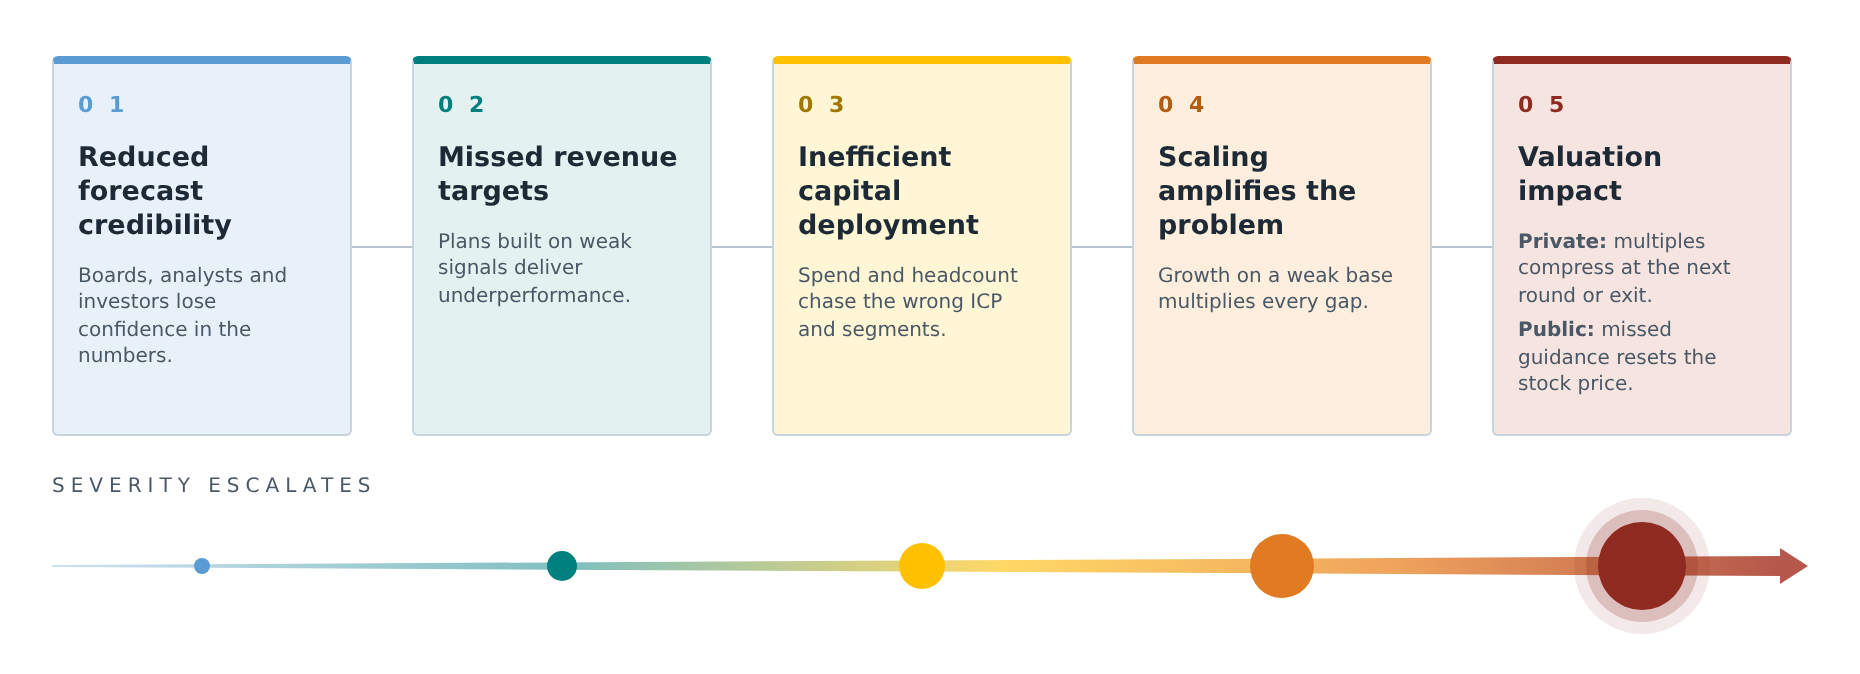
A forecast problem rarely stays a forecast problem. Left alone, it works its way through the commercial engine before it shows up in the valuation or the share price.
What do buyers look at to judge a forecast?
Five pieces of data, most of them already in the CRM, are easy for a diligence team to find:
- Commit against actual for each of the last eight quarters and the variance trend by quarter.
- Percentage of deals that slipped out of the quarter they were committed in and how far they moved.
- Whether pipeline coverage comes from current, qualified deals or from old opportunities nobody has closed out.
- The discrepancy between management's forecast and what the CRM reports.
- How many versions of the forecast exist (sales, finance and the board), how far apart they are and how often the committed number changes within the quarter.
None of these is a judgment about the team. They are facts from the CRM, which is why the haircut tends to be consistent: two buyers looking at the same eight quarters will usually reach a similar view.
How early does forecast risk show up?
In my experience, the earliest warning signs show up in the pipeline two to three quarters before revenue falls, well before the forecast misses.
The signs to watch are fewer new qualified deals each month, more deals slipping out of the quarter, and coverage for the quarters ahead falling below plan. Slowing instrument placements give the same warning for consumable revenue. By the time the forecast misses by more than 15%, the problem is already in the numbers.
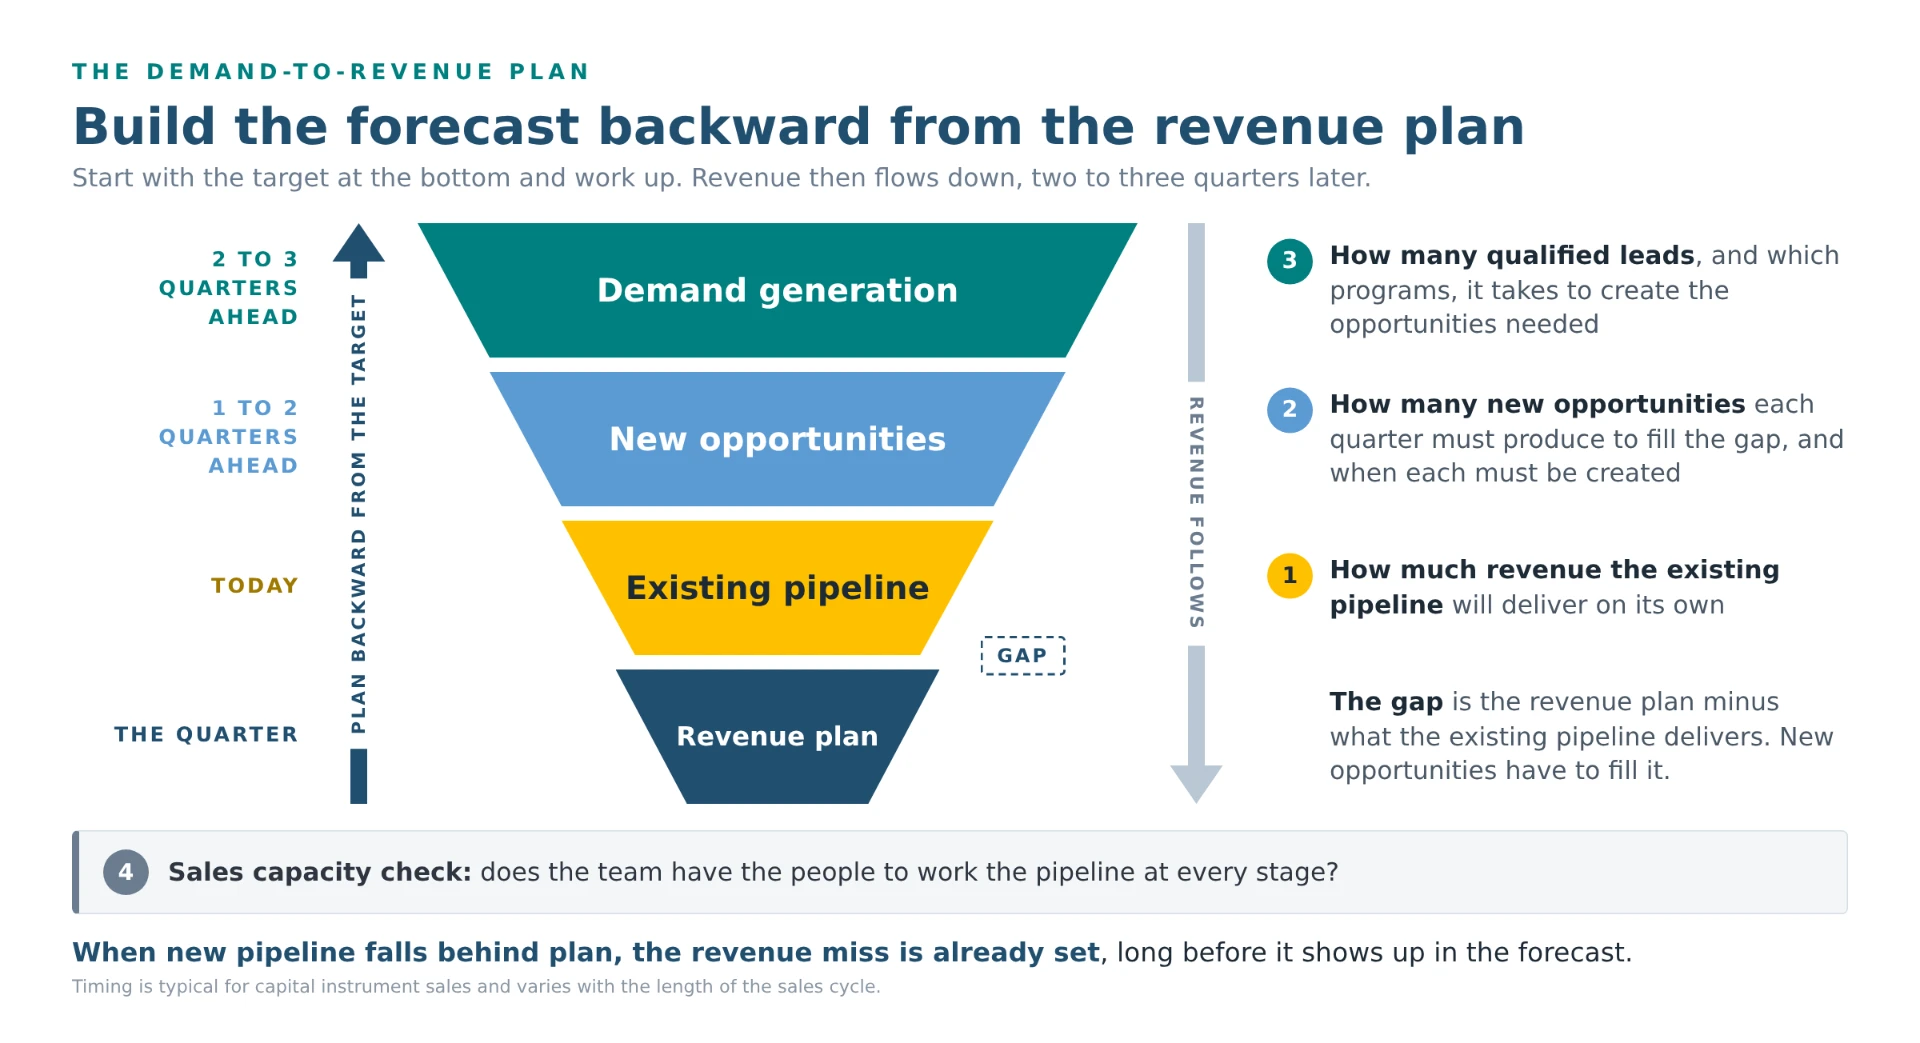
This is why the forecast should be built backward from the revenue plan, through the pipeline, the demand generation that feeds it and the sales team that works it. A model that runs from demand generation through each pipeline stage to closed instruments, and checks the result against sales capacity, shows:
- How much revenue the existing pipeline will deliver on its own.
- How many new opportunities each quarter must produce to close the gap, and when to create each one.
- How many qualified leads, and which demand generation programs, it takes to create those opportunities.
- Whether the sales team has the capacity to work them.
When new pipeline falls behind that plan, the revenue miss is already set for two or three quarters later, long before it shows up in the forecast.
The pipeline gives the early warning because revenue is a lagging indicator. A team can keep closing deals from a pipeline where fewer deals fit the ICP each month, and revenue looks fine until the pipeline runs out. A commit that changes during the quarter usually reflects a weak process (deals qualified without a standard such as MEDDPICC), deals that don’t fit the ICP, or no regular cadence of CRM updates. This often leads to discounting heroics to “save” the quarter, which lowers total revenue and margins and strains the commercial team, who then must support customers that don’t fit the ICP.
A disciplined forecasting process, put in place early, makes the haircut avoidable. The forecast history a buyer will review, or an analyst will use to judge your guidance, two years from now is being created today. When the process has been in place for years, a buyer sees it as how the company runs and gives it credit. When it’s put in place in the six months before a sale, a buyer sees it as a fix and discounts it.
What does an unreliable forecast look like inside a company?
The commit changes week to week, deals sit in commit on gut feel alone, coverage is overstated with unqualified deals, discounts and no-charge add-ons (extra warranty, extended terms) increase, and finance, sales and leadership disagree on the “real” number.
We’ve all been there, and it’s not a good place. Frustration rises as the forecast changes from week to week. Deals sit in commit because a scientific champion is enthusiastic, while nobody has met the person who signs the purchase order. The procurement process is unclear. Coverage looks healthy at three times plan, but a large share of it hasn't moved in a month and heroics kick in to “save the quarter.” Sales SPIFFs are rolled out, which further incentivizes heroics. Everyone has their own number and none of them are the same. It’s ugly!
None of this means the team is weak. The process should be the same whether a company has 5 reps or 200: a standard for what goes into commit, stage definitions everyone uses the same way, and one forecast that sales, finance and the board all work from. With a small team, a sales leader can know every deal personally and cover for a missing process. As the team grows, that’s no longer possible, and the gaps show up in the forecast.
Is an accurate forecast realistic in tools and diagnostics?
Yes. NanoString's product and service revenue averaged 99.4% of the midpoint of its initial annual guidance from 2018 to 2021, and 3 of those 4 years met or beat the range.
The one miss, in 2020, came from COVID-19 lab closures after the company issued guidance, and product and service revenue still grew 7% that year. The full history, and how each figure was measured from the company's filings, is in the NanoString commercial case study at commexadvisors.com/case-studies/ncounter.
How do you fix an unreliable forecast?
With a short list of rules, based on objective data and reviewed on a set schedule with sales, marketing and finance in the room.
- Apply the four deal killers before anything enters commit. The economic buyer has been met directly, the customer has validated the metrics the deal rests on, the decision process is confirmed rather than guessed, and a champion is actively selling internally. If any one is missing, the deal is not forecast in commit.
- Enforce written stage exit criteria before a deal moves forward, so a stage means the same thing for every seller and every deal. All of it is tracked in the CRM.
- Document slips with a reason. Every deal that moves out of the quarter it was committed in gets a documented cause from a short, fixed list, and the team reviews the causes each month for patterns.
- Pipeline coverage is fact-based. The coverage target is set from the team's own empirical win rate. Set limits on how long any deal sits static. 30 days is a good starting point.
- One set of numbers agreed upon by all. Sales, finance and leadership align on the same forecast that is reconciled on a set schedule.
None of these is complicated, but each needs a named owner and a weekly meeting where it's checked.
What should an owner ask about the forecast?
Six questions you can put to a management team this quarter.
- Show me commit against actual for the last eight quarters. How many landed within 5%, and is the variance getting better or worse?
- What percentage of deals slipped out of the quarter they were committed in, and how far did they move?
- How much of the pipeline coverage comes from current, qualified deals, and how much from old opportunities nobody has closed out?
- Does the forecast you present match what the CRM shows, deal by deal?
- How many versions of the forecast exist today, how far apart are they, and how often did the commit change last quarter?
- How long did it take to pull these answers together, and where did they come from?
The last one matters more than it looks. How the answers arrive tells you as much as the answers do.
How does my forecast accuracy compare to similar companies?
Until now there has been no peer reference for forecasting accuracy. The Commercial Predictability Index, which opens December 1, is built to provide one.
The Commercial Predictability Index is a confidential survey for the senior commercial leader at life science tools, diagnostics, medical device and bioprocess companies. It asks how the company runs its forecast, pipeline, sales process and coverage; scores those practices; and reports the results alongside them: forecast accuracy, slippage, revenue against plan and sellers at quota. The questions are designed to answer whether companies with more disciplined practices forecast more accurately and reach plan more often.
The survey opens on December 1. It takes 20 to 25 minutes, doesn't ask for the company's name, and reports only anonymous results for groups of at least five companies. Each participant sees their own result on screen when they finish, and receives a private report comparing their company with peers when the Index is published in the spring.
What does the benchmark do for me?
- It provides a fact-based comparison for leadership and the board. When a CEO or board asks whether something is normal, "here's where we sit against our peers" is a much stronger answer than "I think we're fine."
- It separates the market from execution. If peers also missed plan, the cause is more likely the market. If peers with similar practices hit plan and you didn't, the cause is more likely internal. The Index keeps practices and results separate so that this comparison is possible.
- It corrects self-assessment. Leaders tend to rate their own operation higher than their teams do. Fact-based answers, compared with peers, are much harder to dismiss than a leader’s own rating.
- It shows where to start. A benchmark that ties practices to results highlights the gaps that matter, not just the easy-to-fix ones.
- It measures progress over time. A second year shows whether the changes actually moved results, based on documented data rather than a narrative.
If you lead a commercial team, or own companies that have one, stay tuned. A link to sign up will follow later in November.
How CommEx helps
Most of the data needed to judge a forecast is already in the CRM, but few companies step back and look at it as a whole. The Commercial Readiness Assessment does that, while there’s still time to act on what it shows.
The Commercial Readiness Assessment (CRA©) scores a commercial organization against the nine weighted pillars of our Commercial Operating System (COS©), using 42 statements answered by up to six leaders. It produces a Commercial Readiness Index (CRI©) score out of 100, a map of where the leadership team sees things differently, and a 90-day plan ranked by what moves the score most. Forecast integrity carries the most weight of the nine pillars because it has the biggest impact on revenue predictability and company valuation.
Measure it before it hurts. Book a conversation at commexadvisors.com
Frequently asked questions
What is an underwriting haircut?
It is the amount a buyer or analyst discounts a company's own forecast before valuing it. The size depends on how much the buyer trusts the company's forecast accuracy, and it usually shows up as lower revenue in the buyer's model. For a public company, it can also show up as a lower multiple.
How many quarters of forecast history do buyers review?
Buyers typically look at commit against actual for the last eight quarters, which covers two full years and is long enough to show whether accuracy is a pattern or a one-off.
What forecast accuracy should a tools or diagnostics company aim for?
A commit that lands within about 5% of actual quarter after quarter is the kind of accuracy a buyer underwrites close to plan. NanoString averaged 99.4% of its initial annual guidance midpoint from 2018 to 2021.
What are deal killers in sales forecasting?
Four yes-or-no tests a deal must pass before it can be forecast in commit: the economic buyer has been met directly, the customer has validated the metrics, the decision process is confirmed, and a champion is actively selling internally.
Why does forecast slippage matter to a buyer?
Deals that move out of the quarter they were committed in show that the commit was not well understood. A high slip rate is one of the clearest signals a buyer uses to discount the forecast.
How long does it take to build forecast accuracy a buyer will trust?
About two years, because buyers read eight quarters. A process in place for years is seen as how the company runs, while one put in place in the six months before a sale is seen as a fix and discounted.
Sources
- Illumina: preliminary second quarter 2019 results and revised 2019 guidance, July 11, 2019 (Form 8-K, Exhibit 99.1); share move reported by CNBC, July 11, 2019.
- 10x Genomics: preliminary third quarter 2024 revenue, October 9, 2024 (Form 8-K, Exhibit 99.1); share move reported October 10, 2024.
- Skinner, D. J. and Sloan, R. G. (2002), "Earnings Surprises, Growth Expectations, and Stock Returns," Review of Accounting Studies 7(2).
- The 15% variance threshold and the two to three quarter lead are from my own experience running commercial teams.
- NanoString forecast accuracy: Forms 10-K and quarterly earnings releases, FY2018 to FY2021, as compiled in the NanoString commercial case study (CommEx Advisors).
- The deal killers are from the CommEx MEDDPICC deal scorecard.